Geekbench benchmark of different AWS EC2 instances

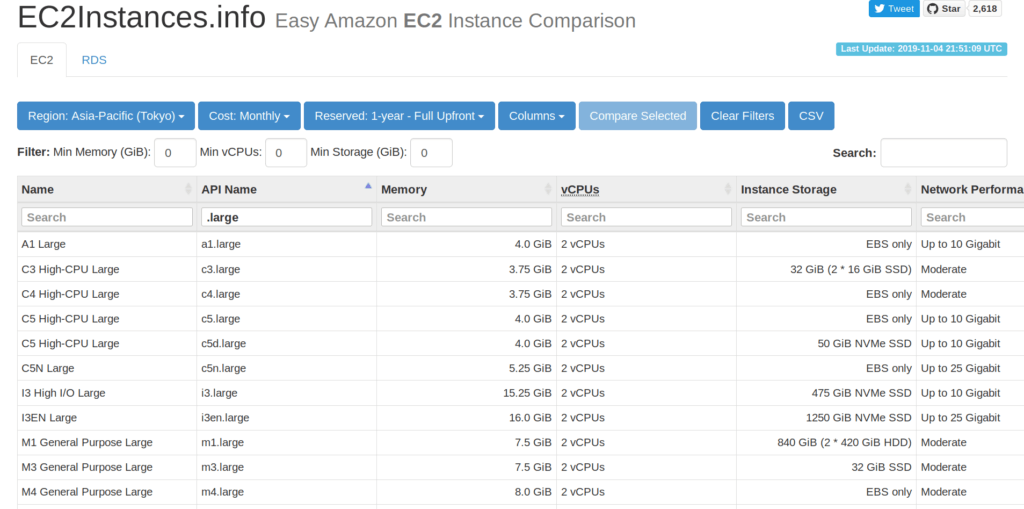
接續上一篇 sysbench CPU benchmark of different AWS EC2 instances ,這邊改用 Geekbench 來做效能測試,Geekbench 是跨平台的效能測試工具,有支援 Windows、Linux、macOS、Android 和 iOS 等系統,測試環境、比較對象和上一篇相同。

測試環境

  • Ubuntu: 18.04.3 LTS
  • Linux kernel: 4.15.0-1052-aws
  • Geekbenck: 5.0.3

比較對象

  • General purpose
    • T2
    • T3
    • T3a
    • M4
    • M5
    • M5a
  • Compute optimized
    • C4
    • C5
  • Memory optimized
    • R4
    • R5
    • R5a

T 系列的機器也都同樣是開 Unlimited Mode 下去跑測試讓 CPU 可以全速運轉

執行時不用特別帶參數,像下面這樣

測試畫面

$ ./Geekbench-5.0.3-Linux/geekbench5 
Geekbench 5.0.3 Tryout : https://www.geekbench.com/

Geekbench 5 is in tryout mode.

Geekbench 5 requires an active Internet connection when in tryout mode, and 
automatically uploads test results to the Geekbench Browser. Other features 
are unavailable in tryout mode.

Buy a Geekbench 5 license to enable offline use and remove the limitations of 
tryout mode.

If you would like to purchase Geekbench you can do so online:

  https://store.primatelabs.com/v5

If you have already purchased Geekbench, enter your email address and license 
key from your email receipt with the following command line:

  ./Geekbench-5.0.3-Linux/geekbench5 -r <email address> <license key>

  Running Gathering system information
System Information
  Operating System              Ubuntu 18.04.3 LTS 4.15.0-1052-aws x86_64
  Model                         Amazon EC2 t3a.large
  Motherboard                   Amazon EC2
  BIOS                          Amazon EC2 1.0

Processor Information
  Name                          Intel Pentium II/III
  Topology                      1 Processor, 1 Core, 2 Threads
  Identifier                    AuthenticAMD Family 23 Model 1 Stepping 2
  Base Frequency                2.20 GHz
  L1 Instruction Cache          64.0 KB
  L1 Data Cache                 32.0 KB
  L2 Cache                      512 KB
  L3 Cache                      64.0 MB

Memory Information
  Size                          7.71 GB

Single-Core
  Running AES-XTS
  Running Text Compression
  Running Image Compression
  Running Navigation
  Running HTML5
  Running SQLite
  Running PDF Rendering
  Running Text Rendering
  Running Clang
  Running Camera
  Running N-Body Physics
  Running Rigid Body Physics
  Running Gaussian Blur
  Running Face Detection
  Running Horizon Detection
  Running Image Inpainting
  Running HDR
  Running Ray Tracing
  Running Structure from Motion
  Running Speech Recognition
  Running Machine Learning

Multi-Core
  Running AES-XTS
  Running Text Compression
  Running Image Compression
  Running Navigation
  Running HTML5
  Running SQLite
  Running PDF Rendering
  Running Text Rendering
  Running Clang
  Running Camera
  Running N-Body Physics
  Running Rigid Body Physics
  Running Gaussian Blur
  Running Face Detection
  Running Horizon Detection
  Running Image Inpainting
  Running HDR
  Running Ray Tracing
  Running Structure from Motion
  Running Speech Recognition
  Running Machine Learning

Uploading results to the Geekbench Browser. This could take a minute or two 
depending on the speed of your internet connection.

Upload succeeded. Visit the following link and view your results online:

  https://browser.geekbench.com/v5/cpu/535166

Visit the following link and add this result to your profile:

  https://browser.geekbench.com/v5/cpu/535166/claim?key=185887

測試結果

接著看測試結果,免費版的 Geekbench 測試時必須要有網路連線,結果不會直接顯示在本機,要上傳到他們的伺服器上看,好處應該是比較不怕造假(假設有對資料做應該有的基本驗證機制)或弄錯,畫面呈現如下,除了效能測試的分數以外,也一些作業系統、CPU、記憶體等資訊:
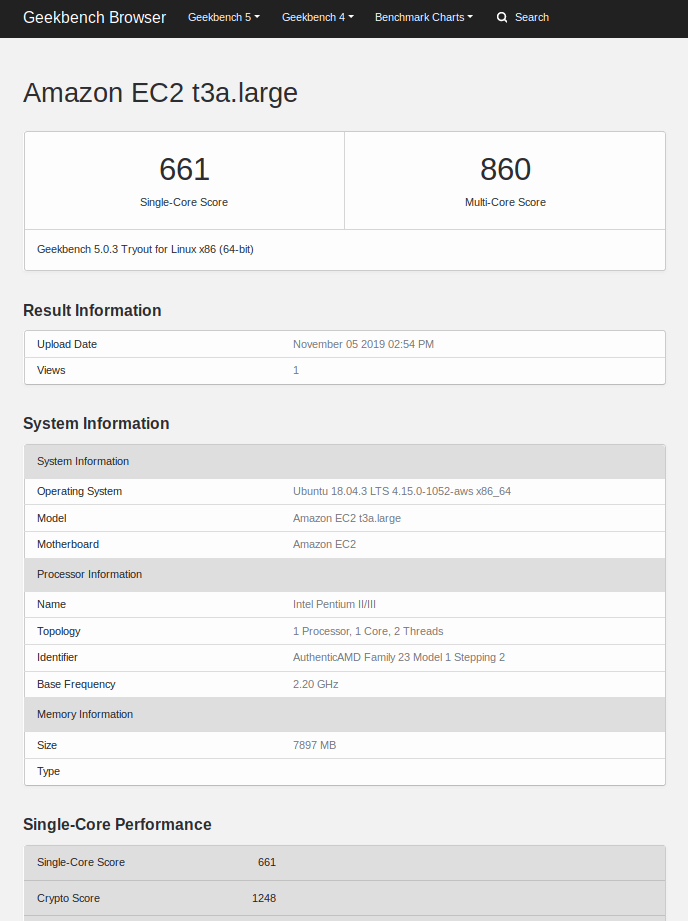
下面是這次測試全部結果的連結:

閱讀全文

sysbench CPU benchmark of different AWS EC2 instances

AWS EC2 推出 M5a/R5a/T3a使用 AMD CPU 的 主機分別有大約一年/半年左右的時間了,因為平時使用到美國境內區域的比例比較少、亞洲更新的時間相對還是比較晚,所以幾個月前才陸續開始使用這幾個系列的機器 (截至目前為止東京都還不是每個 AZ 都可以開 T3a 的機器),除了官方宣稱的 10% 左右價差 (跟 M5/R5/T3 相比) 以外,對於效能這方面並沒有提供太多資訊,想像上以及一些其他管道的資訊多是和同系列但使用 Intel 處理器的主機效能約略相同、或少個 10% 以內的效能,但實際上如何好像沒有太多的討論或比較,這邊就來用 sysbench 這套工具很簡單的比較一下幾款比較常用到、不同系列的 AWS EC2 主機 CPU 效能,方便起見,使用預設值下取跑、且都拿 .large 這個大小的機器來比、只看單個執行緒的測試結果

測試環境:

  • Ubuntu: 18.04.3 LTS
  • Linux kernel: 4.15.0-1052-aws
  • sysbench: 1.0.18

比較對象如下,共十一種機型:

  • General purpose
    • T2
    • T3
    • T3a
    • M4
    • M5
    • M5a
  • Compute optimized
    • C4
    • C5
  • Memory optimized
    • R4
    • R5
    • R5a

因為要測試的是 CPU 的效能,一些跟磁碟、網路有關衍生出來的機型例如 C5d / C5n / M5dn / R5dn 等也就不列入測試範圍了。另外 T1 / C3 / M3 / M4 這種前幾個世代比較舊的機器也不列入這次測試,現在要開機器應該不會開這麼舊的來用了,沒事不會同時跟錢包還有效能過不去,除非有什麼比較久遠的 AMI 沒辦法在新機器上開起來非得用舊機器跑不可 …

其中 T2 / T3 / T3a 系列要靠 CPU Credits 才能使用到最佳效能的機器,在測試時都是開 Unlimited Mode 下去測的 (實際上 sysbench 預設只會跑十秒左右,連 1 CPU Credit 都用不滿) ,拿沒有被卡住的效能比較才比較有

關於各機型的規格/價格比較,建議可以參考 EC2Instances.info ,我覺得這網站還不錯很方便:

EC2Instances.info Easy Amazon EC2 Instance Comparison
https://ec2instances.info/?filter=.large&region=ap-northeast-1&cost_duration=monthly&reserved_term=yrTerm1Standard.allUpfront

接下來就直接看測試結果:

# t2.large
$ sysbench cpu run
sysbench 1.0.18 (using bundled LuaJIT 2.1.0-beta2)

Running the test with following options:
Number of threads: 1
Initializing random number generator from current time


Prime numbers limit: 10000

Initializing worker threads...

Threads started!

CPU speed:
    events per second:   909.23

General statistics:
    total time:                          10.0008s
    total number of events:              9095

Latency (ms):
         min:                                    1.09
         avg:                                    1.10
         max:                                    1.17
         95th percentile:                        1.10
         sum:                                 9983.83

Threads fairness:
    events (avg/stddev):           9095.0000/0.00
    execution time (avg/stddev):   9.9838/0.00
閱讀全文

UP board Windows 10 效能測試

關於 UP Board 的開箱以及硬體資訊可以參考前面這兩篇:

https://www.peterdavehello.org/2016/12/up-intel-x5-z8300-board/

https://www.peterdavehello.org/2016/12/up-board-windows-10/

這篇主要是分享一些在 Windows 10 上面進行的效能測試,使用的都是很容易取得且不用額外花費的軟體,所以很方便可以跟其他平台進行比較、對照。

因為 UP Board 在開發板 / 單板電腦相關產品裏面算是少數網卡都是 1Gbps 規格的產品 (UP Board 只有記憶體和儲存裝置有分不同版本,而網卡是直接走 PCI-E 介面),所以我一開始測試就先連上了 Speedtest Beta (http://beta.speedtest.net/) 想來測試一下網卡的速度是不是真的有 100M 以上的速度,看測試結果確實是有:

speedtest
2ms / 744.77 Mbps / 661.63 Mbps 的速度還算不錯 (IP我有藏起來了就別找了XD)

之後使用 Linux 進行效能測試時會再使用 speedtest-cli 測試不透過瀏覽器的情況下測試出來的速度,以及透過 iperf 在區網內直接和其他主機對傳,更準確一點的測試網卡的效能。

接著從 AIDA64 開始進行測試,因為沒有付費,所以有些資訊會被隱藏

AIDA64 Cache & Memory Benchmark:
aida64-cache-memory-benchmark
閱讀全文

The difference of performance between 3 versions of Raspberry Pi, the comparison.

I have the basic benckmarks for Raspberry Pi version 1, 2 and 3, and here is the comparison, all the benchmarks on different Pis are using the same operating system / package, so there won’t be a difference from the version of software.

The testing platform:

RASPBIAN JESSIE
Version: February 2016
Release date: 2016-02-26
Kernel version: 4.1

Since I just did these benchmarks on Raspberry Pi 3:

https://www.peterdavehello.org/2016/03/raspberry-pi-3-model-b-basic-benchmarks/

The Raspbian and all the softwares are up to date, so the benchmark results of Raspberry Pi 3 are just copied from that post, they are the same result. The results from Pi 1/2 are whole new tested, in fact they are very close to the test results I did before, I would say they are all in the tolerance scope, so I’ll just ignore the detail of the benchmarks, only focus on the final results, the performance.

PHP benchmark Script using PHP 5.6.17-0+deb8u1: (in secs, the lower the better)
Raspberry Pi model B+ – 141.145
Raspberry Pi 2 model B – 48.113, 293% faster than Pi 1
Raspberry Pi 3 model B – 26.984, 523% faster than Pi 1, 178% faster than Pi 2

PHP benchmark Script using PHP 7.0.3-5: (in secs, the lower the better)
Raspberry Pi model B+ – 48.153
Raspberry Pi 2 model B – 17.27, 279% faster than Pi 1
Raspberry Pi 3 model B – 10.239, 470% faster than Pi 1, 169% faster than Pi 2

sysbench v0.4.12 single thread: (cpumaxprime=20000,in secs, the lower the better)
Raspberry Pi model B+ – 1332.0115
Raspberry Pi 2 model B – 765.2441, 174% faster than Pi 1
Raspberry Pi 3 model B – 478.0941, 748% faster than Pi 1, 160% faster than Pi 2

閱讀全文